Dashboards
Summary
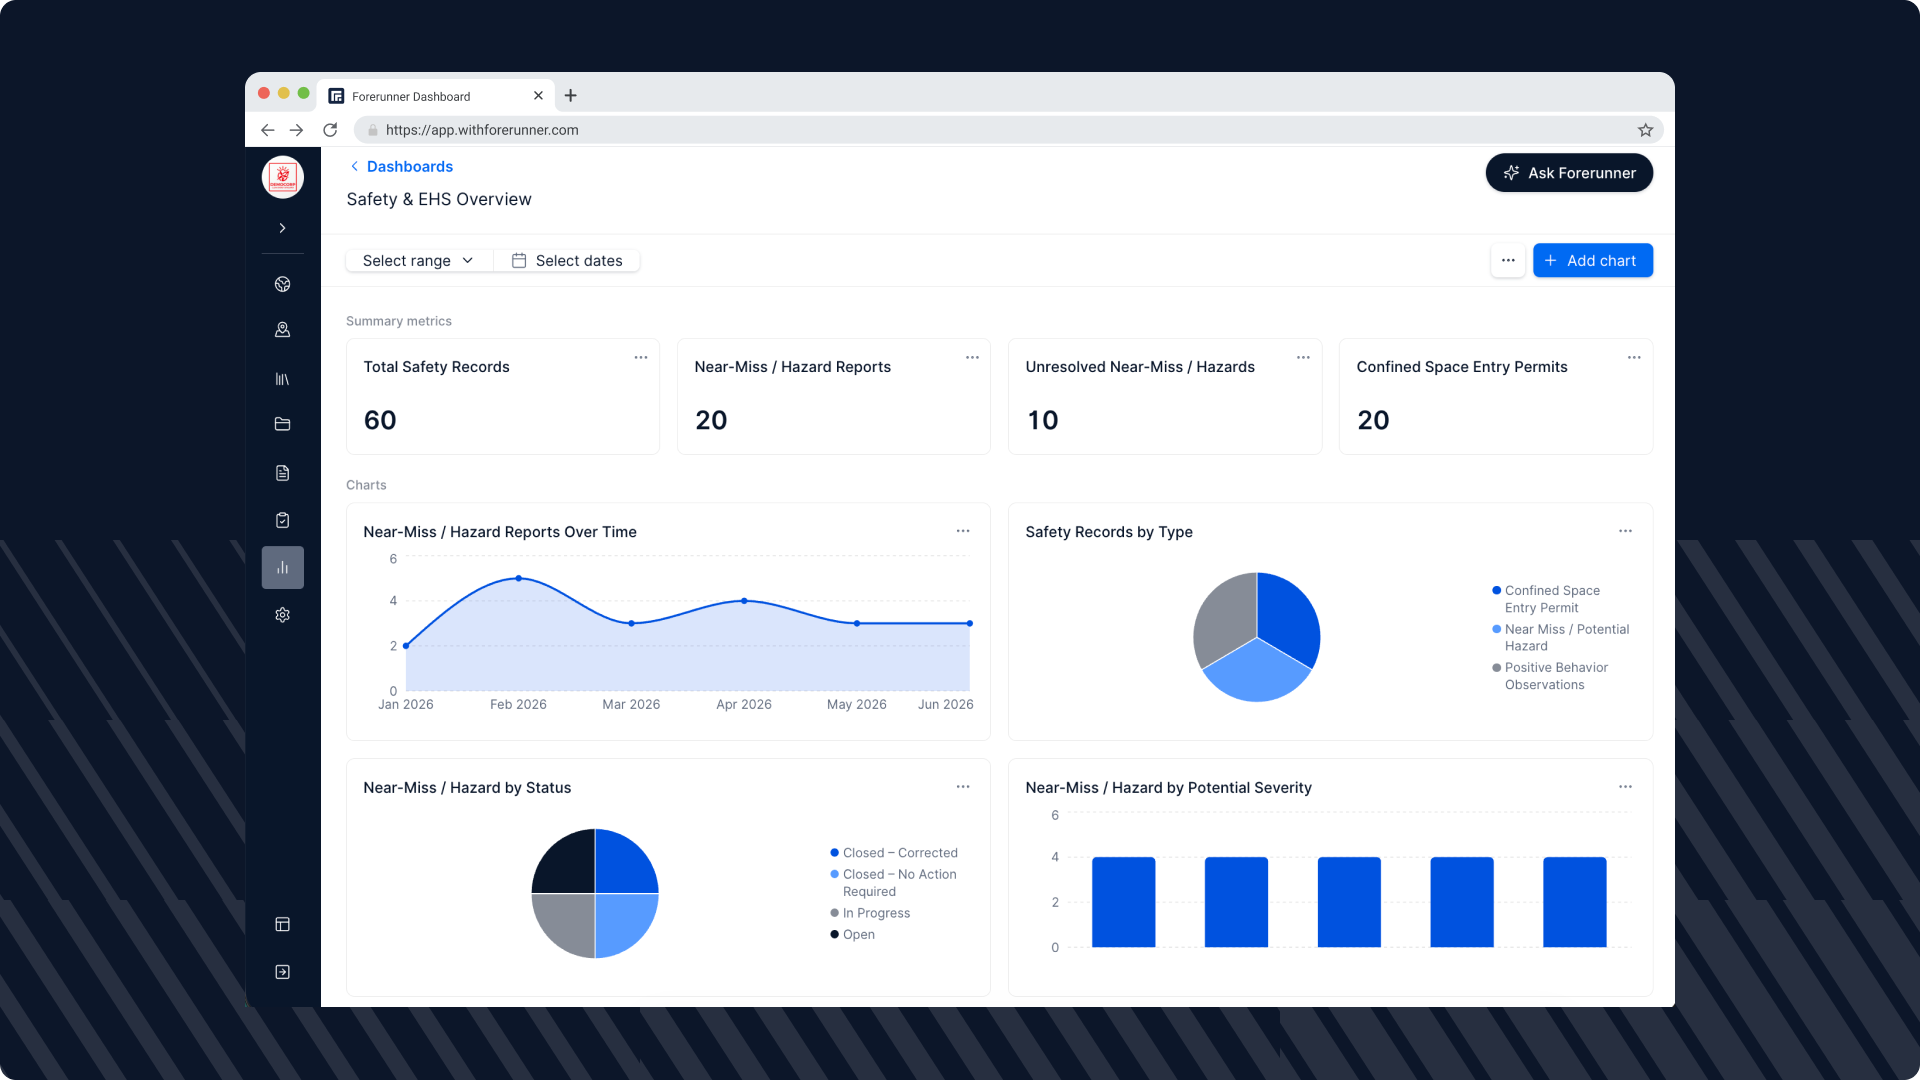
Forerunner's new Dashboards feature transforms the data your team already collects into clear, actionable insights without external reporting tools.
Teams can add charts directly to any saved view, allowing counts, breakdowns, and trends to appear alongside the records they describe and update automatically as data changes. For a broader view, administrators can build standalone dashboards that combine information across multiple record types, such as permits and inspections or code enforcement cases and complaints. With five chart types (metric, bar, line, pie, and table), Dashboards support the reporting agencies rely on most, including totals, comparisons, trends, and category breakdowns. Every dashboard features a global date filter, with the flexibility to override it on individual charts to filter by different date fields. Additionally, users can click any data point to instantly view the underlying records.
Instead of exporting data into spreadsheets to answer routine questions, teams can monitor performance and activity directly within Forerunner. Whether it's a floodplain administrator tracking elevation certificates reviewed each month, a code enforcement manager comparing cases closed by officer quarter over quarter, or a program manager monitoring inspection progress throughout a multi-year recovery effort, Dashboards provide real-time visibility into the work that is already happening.
To learn more, contact your Customer Success Manager or email hello@withforerunner.com.
FAQ
Ready to see how Forerunner can support your community?
Book a demo